With the rise of the Delta variant, the renewed hysteria in the media, and the troubling push for internal passports on my mind, I thought it would be interesting to take a look at the numbers available for COVID mortality within the context of the numbers available for general mortality. For this exercise I looked only at the numbers for the USA, using data published by the CDC. Full mortality reports seem to be published about 1-2 years after the year for which the data is gathered, but partial/preliminary reports with headline numbers are available for more recent data, including data encompassing the COVID pandemic. Therefor I used numbers from the National Vital Statistics Reports on leading causes of death for 2019 (source), from the data-briefs tables for 2018/2019 mortality (source), and from the COVID-19 provisional counts tables (source) in my analysis. I also feel I should caveat everything I’m about to write by reminding the reader that I am not a health expert or a statistician, and that this is (as the title states) merely a back of the napkin analysis of the data.
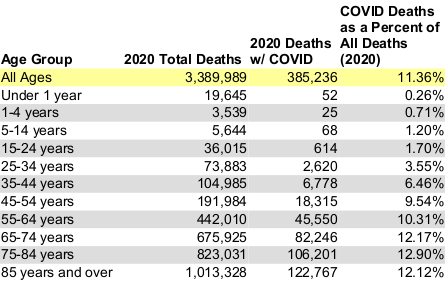
The first place to start when looking at the data is the CDC’s own table for COVID deaths for 2020 (I excluded 2021 data so that I could do year over year analysis, and also because 2021 is ongoing and even the data for the year so far is incomplete as there are always reporting and tabulation lags).
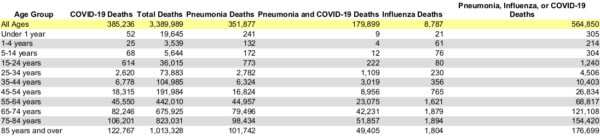
Of note, the CDC includes not only COVID numbers but also pneumonia and influenza numbers in their COVID data sets. The apparent reason for this is that not only was 2020 a year clouded by a novel coronavirus pandemic, but it was also a year of anomalously high respiratory infections in general. These two things are in some way related, which is why the CDC chose to present the information together (for context, the CDC usually groups pneumonia and influenza together when tabulating cause of death). The table is a little bit confusing, as it appears the columns for COVID and pneumonia both include cases of death caused by a conjunction of these two conditions, which is also presented in its own column. Separating the headline numbers out, it appears that in 2020 there were about 206 thousand deaths attributed to COVID alone, about 180 thousand deaths attributed to COVID plus pneumonia, about 170 thousand deaths attributed to pneumonia alone, and about nine thousand deaths attributed to influenza.
For context, I decided to look at how the pneumonia+influenza numbers for 2020 compared to the pneumonia+influenza numbers for 2019. To do so I subtracted the reported COVID deaths from the reported Pneumonia, Influenza, or COVID deaths category to get numbers for pneumonia and influenza alone and compared the numbers reported for the pneumonia+influenza category from 2019 in the table below. Note that for certain age groups in 2019 (marked by asterisks) I had to estimate, as the data sources I used only provided categorical numbers for the top ten causes of death in 2019.
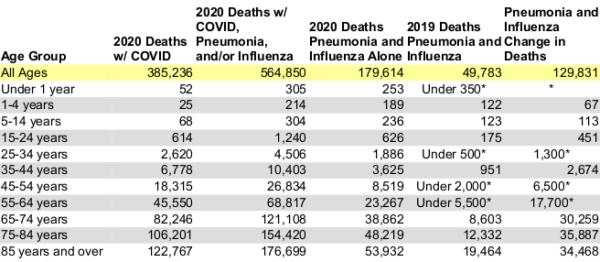
It appears that in addition to the COVID pandemic, 2020 saw a more than three-fold increase in pneumonia and influenza deaths as well. While it is possible that some of these cases represent under-reported or misclassified COVID deaths, the entire health industry in the US seems to have been very diligent at trying to track and report COVID, so it seems unlikely to me that COVID deaths would be under-reported to the magnitude required to explain this entirely. It is also possible that some people survived COVID in a weakened state that left them susceptible to subsequent respiratory infection. Yet another possibility is that there was some under-reported shadow pandemic spreading simultaneously with COVID, accounting for nearly a fourth of the additional deaths caused by respiratory infections in 2020. In any case, I think that this massive increase in non-COVID respiratory infections calls into question the efficacy of the measures taken (especially masking and social distancing) to prevent the spread of respiratory infection.
Of special note in consideration of the fact that the school year will be starting soon, in 2020 even with the COVID pandemic in full swing influenza and pneumonia were still collectively a greater threat to the under 25 crowd than was COVID-19. This should come as no surprise to anyone who has been following the developing story of COVID, but it is still worth noting to put the disease into perspective. The reverse is true for the older crowd (again, no surprise), with COVID contributing to over twice as many deaths as pneumonia+influenza in the over 55 crowd, who were already suffering three times as many deaths from pneumonia+influenza as in 2019.
Taking a step back and looking at the year over year total death numbers, it is clear that 2020 was a year of anomalously high death.
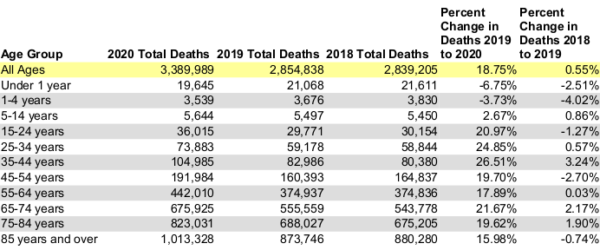
Comparing the change in death numbers from 2019-2020 to the change in death numbers from 2018-2019, it is clear that the pandemic and related events took a significant toll on the population. Every age group from age 15 on up saw a spike in deaths of around 20%, although the under 15 group seems to have been largely unaffected. However, as we know that COVID hits the old far harder than the young, I decided to try to break out the numbers further to see where the change in death is occurring. To that end, I took the total change in deaths for each category and subtracted out the COVID deaths and the change in deaths attributed to pneumonia+influenza (calculated earlier) to arrive at numbers representing the change in deaths year over year attributable to causes other than the increase in respiratory mortality.
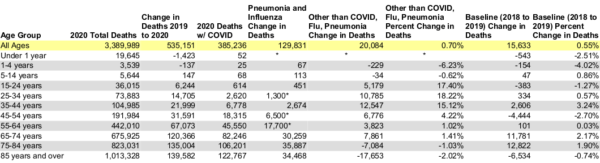
In general it appears that the increase in deaths from non-respiratory causes is similar to a normal year-over-year change. But there is an exception: the age groups 15-44 have an anomalously high death spike that is not attributable to the pandemic and other respiratory disease increases that befell the nation in 2020. This is concerning, and when the CDC publishes their cause of death numbers for 2020 it will be interesting to see where these increases in deaths came from. As we will look at later in this article, deaths due to human action (accidents, suicides, homicides) are typically some of the leading causes of death in these age categories, so it is not outside the realm of possibility that the reaction to the pandemic (both social and political) is responsible for an increase in deaths in these age categories. It is known that the lock-downs have had a deleterious affect on mental health, which would be a likely contributor to an increase in deaths due to human action. Until we see the final numbers this is just speculation, but it is surely an area of concern that needs to be studied and addressed so that it can be taken into consideration when determining the best course of action to face future pandemics.
In addition, it is worth considering whether the scale of the reaction was warranted with respect to the scale of the disease. COVID was a real danger to many people, but when put in context with overall mortality it does not seem to have been quite the cataclysm that it is often portrayed as.
COVID accounted for no more than 13% of all deaths for any age group, a significant number but still short of being a top concern for any except the elderly and infirm. For the younger crowd, who fortunately suffer lower levels of death in general than their elders, COVID represented an even smaller portion of this already smaller number of deaths, to the point where I don’t think it can hardly be said to be a danger worth altering their lives to avoid. To get greater context on this, I decided to compare the 2020 COVID death numbers for each age category with the numbers for the top 5 causes of death from 2019, graphed below.
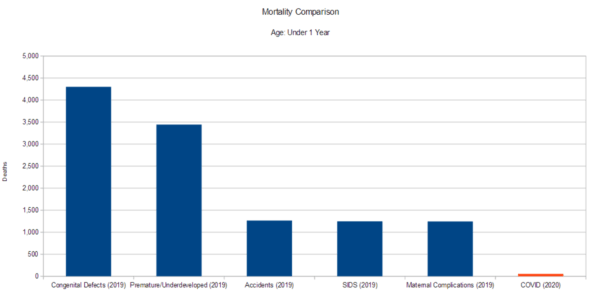
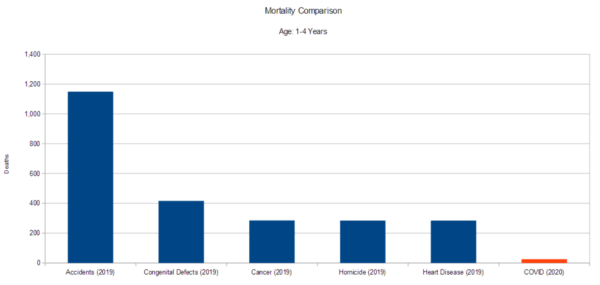
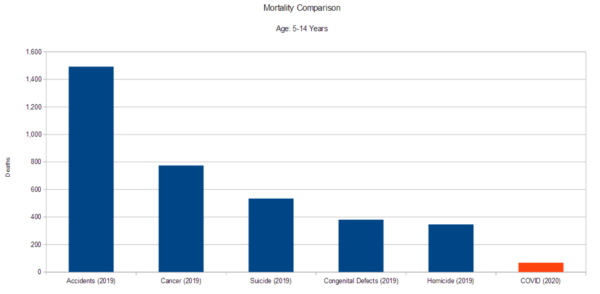
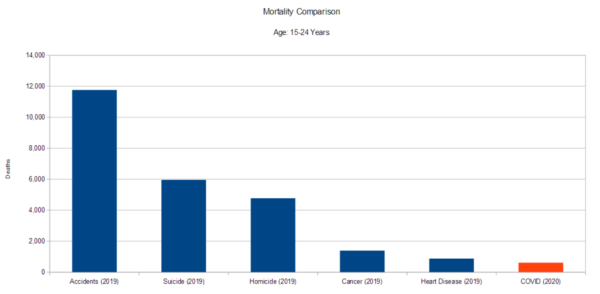
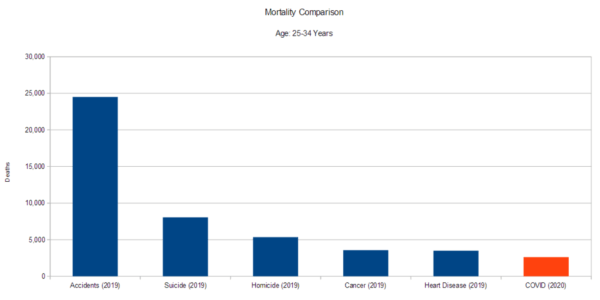
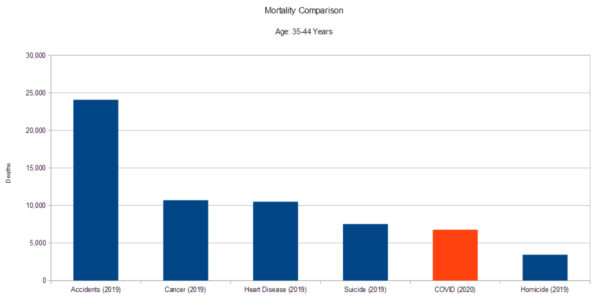
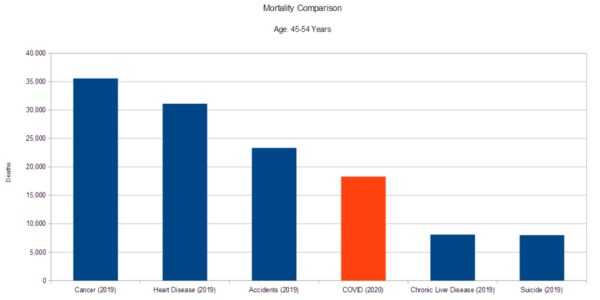
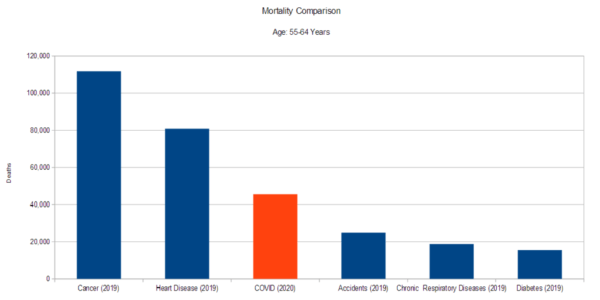
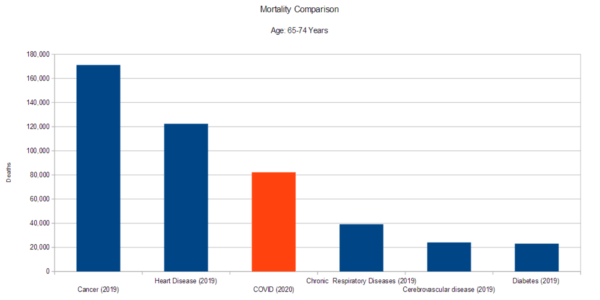
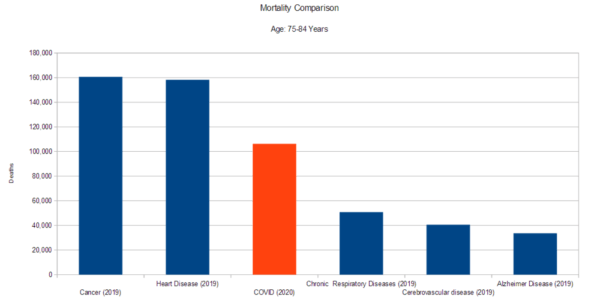
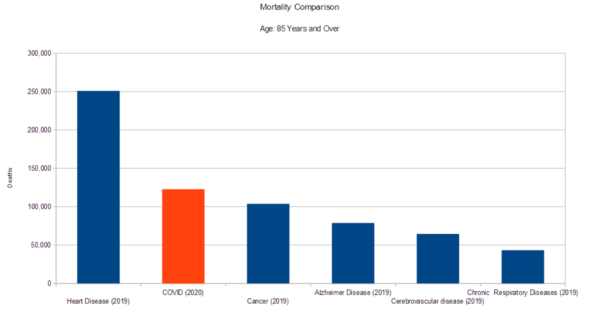
As we can see, COVID doesn’t challenge the top 5 for any age group from birth up to age 35. After then it becomes a greater threat, surpassing deaths due to human action for those over 55. Even so, for no group does it threaten to take the number one spot. It will be interesting to see if these numbers line up the same when the CDC publishes their all-cause cause of death numbers for 2020, and it is possible that COVID will prove a greater threat for the elderly than these graphs predict, due to the fact that COVID deaths are frequently accompanied by many comorbidities that may have caused death in the absence of COVID, thereby shifting numbers from one cause of death column to another. The fact that non-respiratory deaths for the very elderly were lower in 2020 than in 2019 seems to indicate that to some extent COVID was a harvesting event that culled people who would have died due to other causes. Overall, this comparison indicates that while the disease is a danger worth taking precautions against, it is not especially exceptional in the pantheon of threats to human life.
In sum, a brief look at the data indicates that COVID was a danger that caused great harm to certain groups (especially the elderly) and was due proper consideration but was not the existential threat it has frequently been presented as and probably did not warrant the unprecedented steps taken to prevent its spread. Indeed, there is a probability that the lock-downs themselves caused more harm to the younger age groups than the disease itself did, something that should be given due consideration in the future. Hopefully when passions subside and more data comes in this whole episode can be judged in a more measured way, so that in the future we can avoid the mistakes of the past.
Data is Hard!
You are really Harding my mellow.
In NJ Murphy is requiring masking in the schools which I think serves only to be abusive.
Damn autocorrect – harshing.
I saw a mention of pneumonia in the AM post comments. I wonder if delayed access to healthcare contributed to worse outcomes.
OT. Dogen had a paid subscriber pay for public release of a really good pitch accent video. It came up yesterday I believe.
I saw the video but haven’t watched it. Thanks!
More OT. Sony Japan in the past month put more of their old catalog on YouTube.
Just found Whiteberry and Zone.
Prior to this it was always bootlegs.
Damn it! Seeing what they had, I saw a video for a T Square special edition collection. There goes my ammo money.
I got pneumonia on top of the ‘Rona.
I finished the antibiotics but still have a few pneumonia symptoms. I talked to a doc today, and the doc says the antibiotics I’m on will linger in my body for a while, so give it a few more days.
I underwent no treatment for the ‘Rona, which I’m fine with. The ‘Rona isn’t a problem for me, it’s the pneumonia.
How are you doing on sense of taste and smell.
Coworker and his wife with the ‘vid noted they took about 3 weeks to go fully back to normal.
Sense of taste never went away.
My sense of smell is weak normally, so, I can’t tell if there is a difference.
I hope you are feeling better soon, regardless.
This. Take good care of yourself.
x3. Take care, DEG.
I see governor Kunt face is reinstituting masks. A move so necessary that she hasn’t decided when it goes into effect.
Fucking unreal.
Yeah. Started to call the govs office to bitch out some hourly screener and get ignored in the roundfile but decided to cool off some before doing it.
I do think there’s going to be more unhappy people even if they are complying with her diktats.
Thanks Gadfly.
Seconded.
Maybe when the boomers die off. Gen X will never be able to command the world the way the boomers have.
We of Gen X are like Prince Charles. We aren’t going to have a long reign.
Gen X will be leapfrogged.
What about people my age, not Boomers, not Xers?
/57 Years old
You’re a late boomer.
Sorry.
What about 55? I’ve always felt more boomer than X, but my birthyear is always the first of the Xers.
55 too, I feel like I don’t belong to either generation
Go with your gut.
I’m only 3 years younger than you and I’m firmly Gen X.
I have 3 older brothers (59, 58, 57) and they seem a different generation to me.
??♂️
This, but not my Uncle, who is a true Boomer,
/1947
You don’t even know what a Boomer is, Yufus!
I’m almost 50. I’m super Gen X, and I feel it (disenfranchised, fairly apathetic)
OK, Millennial.
My wife’s coming up on 50 next year and we are certainly from different eras. She remembers the seventies but the late seventies and as a small child. The late eighties was when she “grew up”.
The earliest “big” event I remember was the Bicentennial, when I was 4. I feel like it would have been a ton of fun to have been a bit older in the mid-80’s. Like, 18 in 1984 seems like it would have be awesome.
The earliest big event I remember was the Watts Riots. For ealz. I was 4.
It was. I’d never trade it in a million years.
Realz.
Anyway, my wife and I are both over 60 now. So, OK, Millennials.
The 70s and 80s were SO different. I feel that those of us who have only a hazy memory of the 70s form a different “generation” from those of you (like my older brothers) who have a much stronger memory of the 70s.
You should read this book. It covers that era really well.
If you cannot remember the 50s, 60s, 70s, or 80s at all, sorry, your life was over before you were ever born.
All of y’all is really early Millennials.
Early millennials are birth years of 1985 to 1992 ish. Anybody born before that has memory of MTV when it played music videos.
Fuck, dude, I’m a Boomer and I barely remember when MTV played music.
LOL, Midnight Special or GTFO!
Let the Midnight Special shine an ever fucking light on you, Millennials!
No, this Midnight Special ( although the other is one of my favorite CCR songs.)
I thinks this was 76?
Boys are back in Town
That shit was on right after Saturday Night Live. The real one with Belushi, Akroyd, Radner, Murphy, etc.
Jesus is just all right? WTF? *Antifa hurls chucks of concrete at te chillins*
You’re on a mission from God? They’re ain’t no God! *Antifa hurls chunks of concrete at teh chillins*
It’s just what we did at midnight on Saturdays. After SNL.
Am I nuts or did SNL end at 1AM?
Not in the seventies. It was 11:00 til midnight.
See. I don’t remember the 70s. It was always 11:30 to 1:00 for me.
Night Flight or GTFO 🙂
Whoa! There’s a show I haven’t thought about in years.
I also am double nickels…feel between categories.
Double nickels on the Dime.
https://www.youtube.com/watch?v=v8ebtAYQADM&ab_channel=MISCchout
OK, Millennial.
Thanks for crunching the numbers (as they are because they are a hot damn mess of shit and fraudulent) Gadfly. One question though, I was told there was no flu last year. At. All. How did people die from Influenza? Am I being lied to?
Also, I think if one was to truly judge the impact of this fraud, one should look at the years of higher influenza deaths which 2019 wasn’t one of them. You are doing what I would have been/was doing when I got sent home from work but seems my work actually requires me to be there so I only got 30 days to slow the spread sit at my desk time of that back in March 2020. Now they make me actually work if I want a paycheck.
Am I being lied to?
Yes… by everyone… all the time. It’s the only safe bet.
Most people don’t lie all the time. Of course, discerning a person from an NPC can be difficult.
I have never thought what you say is a lie Hyp so I am not buying that. I assume you claim crazy ass hardline libertarian beliefs in good faith and are just wrong in many cases in these trying times. Private companies fronting for the authoritarian Man lose their private company card. That should be the position any freedom minded individual takes IMHO.
Is this one of those statements that saves humanity from the thinking machines?
+1 Butlerian Jihad
Especially by Hyperbole.
Nice breakdown Gadfly.
The manipulation through financial incentives for reporting Covid deaths makes me cautious of CDC’s numbers. While it won’t be applicable to high-risk groups, I’ve been using the placebo group in clinical trial data as a proxy for the risk of Covid in the general population. The just released Pfizer data had just two deaths due to Covid out of 22,000 non-vaxed people in the placebo group over a six month time span. The average unvaccinated person has a greater risk of death doing pretty much any mundane daily task than from Covid.
The manipulation through financial incentives for reporting Covid deaths makes me cautious of CDC’s numbers.
We have video of public health officials admitting they count a covid death for anyone who dies from anything whatsoever including car accidents if they test positive for covid. The numbers are absolute garbage. This has been the biggest con ever done on the planet. Pfizer has did well the last quarter though.
did well. Fuck. Slipped into redneck talk there. Apologies.
We know you really meant, “done did” But, that don’t confront me none.
Perfect.
You done good, anyway.
Dammit!
Dun gud.
Nice breakdown Gadfly.
Thanks!
The manipulation through financial incentives for reporting Covid deaths makes me cautious of CDC’s numbers.
Same, but I don’t have the expertise to make any sort of judgements so I just figured to take them as-is.
The just released Pfizer data had just two deaths due to Covid out of 22,000 non-vaxed people in the placebo group over a six month time span.
Given the very low levels of death among the younger crowd reported in the CDC’s numbers, I believe it. The fact that the under 45 crowd is more likely to die of suicide than COVID means it’s just not a big threat to large portions of the populace. And I imagine vaccine tests skew younger/healthier, for obvious reasons.
I think taking them as-is shows that even with very loose numbers how small the issues really are.
Fauci: (heard in heavy northeast accent) Frankly, you don’t know what you’re talking about! I don’t know what I’m talking about either, I throw like a girl, and I don’t have that Nobel Prize I deserve. But frankly, I’m an expert!
COVID troo da anus
https://www.youtube.com/watch?v=YzSgXonr0X0
SCIENCE! WE LOVE IT!
Me: (heard in heavy Appalachia accent) Okey dokey, chipmunk face, we don’t take kindly to the likes of you round here. I was gonna delete my Youtube account, but I don’t have one. And that’s Rand Paul y’all are fucking with. To you, chipmunk face, that’s Rand Fucking Paul.
Well if this doesn’t convince you stupid redneck Trumptards to get the vaccine, I don’t know what will.
Twatter is bad enough, but Twatter linking to TikTok?
Deep squared
Derp^2, stupid autocorrect.
I saw that this morning. That freak has some follower on whatever “team” that chooses such promos. How do you say out of touch in Uber Dork?
I heart data.
So, I’m preparing myself for my tent revival meeting with the county dept. of health.
I’ll be using a couple of Trashy’s questions, mainly the phase 3 trials and the reduced efficacy leading to how many boosters question. Additionally, I plan to ask how many drugs which are submitted for approval are eventually approved. The FDA (prior to the ‘vid) says of 5000 submitted, one gets approved.
Then, how long is the average period of time that a drug takes to get approved, from the time it’s submitted? The answer is 10-12 years.
Then, when were these 4 drugs submitted?
Then, I will use another of Trashy’s, who will be liable for any damage, if the hasty approval process lets a dangerous drug slip through?
Then, I will ask how many people have taken this drug more than 5 years ago and been watched for side effects?
Then, I will ask what is the level of reporting to AERS before and then since these vaccines began widespread usage?
Any suggestions will be considered. I’m pretty sure I’ll get silenced as quickly as they can. The flyer says they are here to answer any questions. I have these, at least.
“How the hell could you pardon Nixon?” 😉
Can’t think of any improvements, but we’re with you.
Nobody I know voted for him.
When is it? You think you’ll get to submit 8 questions?
your spirit animal (whom I probably first heard of here): https://citizenfreepress.com/column-1/dreadlocks-dude-is-wide-awake/
Tomorrow morning. I doubt they’ll even let me get more than two, but I’m going to try.
I did not see any questions Trashy submitted but I would go with current CDC guidance (vaccinated should mask because they are getting and spreading the virus) and question why one should bother getting it? When they counter with well it is less severe if you get it, ask “What age group is it less severe for? The age groups it has been always been less severe for?”
The assholes are using the fact that those who get vaccinated do not get extremely ill from a disease they would not have became extremely ill from even if they not had the vaccine which proves the vaccine works. I have not deep dove into it, but from what I am hearing from Israel which was first on the mass vaccine train is the vaccinated are filling the hospitals. Bottom line in my mind is it don’t work but they are doubling down.
The only reason I am not slumbering atm is because I am replaying an event at work in my head over and over because I am a mental defective and can’t just comply. I made the mistake of asking if we were going to do the whole Covid of last year over again. One supervisor said, well we are bound by the laws passed. I being the jack ass I am said. “they are not laws”. I got the hand wave head turn bark of “Do not start with me on this [REDACTED]. I scowled. This from a woman who has not a problem sending her four year old to preschool in a mask. I have lost a lot of respect for a lot of people this past year. I will not do another year of it.
Aw, gooble gobble, whatever they do to you.
“It’s not a law” is a very good argument.
Because it’s not a law.
I noticed they are starting to use percentages, but only for the people who have gotten “breakthrough” infections. They tell me that .ooo6% have died, .06% have been hospitalized, etc. They ain’t about to tell anyone that .18% in general died. You mean I have a 99.8 percent chance of being just fine, if I don’t do any of this shit? Even more when I consider age/health, etc.
They have since the beginning pulled the percentage bullshit. Never real numbers, and even when you could search out real numbers they were horse shit because they count any positive test with a bullet hole in his head as a covid death.
Ask if they are doing this in LA to increase deaths like they are in CO.
Twice as hard. Team blue runs this place. Whatever benefits them is turned up to eleven. What detracts is so low, only the dogs can hear it. The only reason I’m having to fight this forcible mainlining of the secret sauce is because it benefits Biden, who asked Newsom, who told Garcetti to do this. Sure the fuck ain’t science.
Welp, I gave my drug sample today for the new job (which I have not yet announced and could still back out of if needed).
Cuz nothing says “We welcome you as a trusted member of the team and value your dignity” quite like saying, “Here, take a whiz in this cup.”
One of the other things listed is needing to prove citizenship (no problem) and “report Covid vaccine status”.
Welcome to the new normal.
Bleagh.
So the Scottsdale job is offering more $ than the Tucson job, but I think the Tucson job has more room for interesting tech opportunities and growth. I wish I could magically divine the work culture of each…
Both have extended excellent relocation packages, including pack and move as well as 2 months in temporary housing while I house hunt.
The Nevada job hasn’t called me back since last Wednesday. I haz a sad…
My brother does this every time he gets a new gig too. Last time he said yes to both, went to the one that started first and hated it and left to the second one where he seems happy. They have been WFH and he’s…well, less than socialized, lets say. He’s gotten in way less trouble at this one.
Sounds like a couple good options on the table. I bet Tucson is nicer than Scottsdale. Just a hunch, because I’ve never been to Tucson. Tucson seems like it would be more charming & historical.
But honestly, I’d probably just go with the best job, regardless. Are there any former employees of these places that could give you an idea of the cultures?
Scottsdale is more upscale. It’s the nice part of Pheonix. Tuscon is more rural-ish. They have a big international airport and you can get most stuff a big-ish city has to offer, but it’s more informal. Like no sidewalks and lot’s of dirt roads with ranches, etc. Scottsdale is more golf course and malls, by comparison.
Scottsdale is just a place fo da poh peeples of Arizona…
Uhhh, Blackjack, Uhhhwattrrruuuudoinere?
Just get on the the 101 and then take a left on the 10 and keep goin until you’re outaere!
I gotta get off at the Slauson cutoff, cut of my slauson and get back on the freeway.
HEY-o!
Your advanced knowledge of logistics and geography is evidence of your white supremacy.
Left turn at Albuquerque
https://www.youtube.com/watch?v=e8TUwHTfOOU
So, nicer than Scottsdale
Very much yes.
Absolutely. The “Old Pueblo” is far superior to the “Valley of the Sun”. I have lived in both areas and Tucson is definitely superior.
Didn’t know you were moving. I hope all goes well, and you pick what’s right for you. Are the employers listed on Glassdoor or any other place you might get an idea of culture?
Based on my knowledge of the Phoenix/Scottsdale area, I’d probably choose Tucson, as the sprawl of Phoenix is not really to my liking. If Tucson is more rural, I think I’d prefer it. Seems like you’d have a better chance of living out in the boonies if you worked in Tucson versus Scottsdale.
Plus, if you’re into guns, I understand theshooting scene near Tucson is quite good, and I think Ian McCollum of Forgotten Weapons lives in the area.
” Separating the headline numbers out, it appears that in 2020 there were about 206 thousand deaths attributed to COVID alone, about 180 thousand deaths attributed to COVID plus pneumonia, about 170 thousand deaths attributed to pneumonia alone, and about nine thousand deaths attributed to influenza.”
I find that surprising that there were so many non-pneumonia covid deaths. How did they die?
Also, the numbers of covid and non-covid pneumonia deaths are almost identical.
“In general it appears that the increase in deaths from non-respiratory causes is similar to a normal year-over-year change. But there is an exception: the age groups 15-44 have an anomalously high death spike that is not attributable to the pandemic and other respiratory disease increases that befell the nation in 2020. This is concerning, and when the CDC publishes their cause of death numbers for 2020 it will be interesting to see where these increases in deaths came from. As we will look at later in this article, deaths due to human action (accidents, suicides, homicides) are typically some of the leading causes of death in these age categories, so it is not outside the realm of possibility that the reaction to the pandemic (both social and political) is responsible for an increase in deaths in these age categories.”
To me, it doesn’t look like that much of spike, but it could be from a decrease in medical care due to fewer people seeing their doctor in person, hospitals delaying procedures, EMS being overwhelmed, people being scared to go the hospital or call an ambulance, etc.
Ain’t nobody went near an ER all year. The few times I saw kids playing, their parents would bitch at them to not get hurt, saying they weren’t going to the hospital if’n they did.
“ I find that surprising that there were so many non-pneumonia covid deaths. How did they die?”
Maybe they had undiagnosed pneumonia. When I had Influenza A in the 2017-2018 flu season (a bad season) I got so sick I was hospitalized. Steroids weren’t having any effect. I was overweight and has asthma so I think they’d pretty much given me up.
I had to chart my rapidly declining lung volume capacity on my own laptop PC and grab a doctor by the sleeve to insist to her that something more was going on than flu. She hesitated a couple of seconds, ordered and X-ray and a sputum culture.
Within the hour they saw I had pneumonia, started IV antibiotics, and I was on the mend.
I’ll bet a lot of “Covid” patients who didn’t have advocates and couldn’t self advocate died of undiagnosed pneumonia.
I’m glad that worked for you! The story makes me rather angry, though. That’s the kind of thing you’re paying doctors for. It’s why they’re respected. It’s tragic when they aren’t motivated or capable to do the kind of thinking that they’re supposed to be able to do.
That is the kind of shit my Dad raged against and yelled at his students (prof of med at U of IL – part time) about – talk to humans and find stuff out.
+3 Golden Apple Awards at U of IL
The Doctors have been instructed that if someone is diagnosed with covid, they send the person home and they will either get better or get so sick they will come back and die in the hospital. No treatment whatsoever administered. This happened to a coworkers grandmother and a coworker. My coworker, a young healthy person rolled right through, grandma not so much. Luckily, many doctors do not follow that and try to treat their patients. The Doctors who treat their patients are shunned from normal society and relegated to talk on you tube channel and podcast interviews about the treatments that do not exist so the vaccines could get EUA so the pharmaceutical companies could “help” people. I am not saying we are at peak evil, but we are sneaking real fucking close to that line.
My friend’s doc told her to stay home. Then she’s popping up with sats in the 80s and he told her to go in, but it was clear he didn’t really care all that much and/or he didn’t think there was anything that could be done for her. She has COVID with complicated pneumonia. Two different things? I don’t know if it’s COVID pneumonia or COVID WITH pneumonia. Anyway, she does not know what they’re giving her and she has no advocate and can’t have visitors.
“she has no advocate and can’t have visitors”
That makes me so mad.
Thanks, Gadfly, I did the number thing when the shootin’ match started last year. You did a far better job articulately the results with your graphs.The problem is overcoming Fauci et al and the drug companies. It’s always “Follow the money”.
I’m not suggesting that certain government employees were paid in money, there are some whose status and reputation were enhanced by ignoring the facts and making solemn pronouncements.
To me, it doesn’t look like that much of spike, but it could be from a decrease in medical care due to fewer people seeing their doctor in person, hospitals delaying procedures, EMS being overwhelmed, people being scared to go the hospital or call an ambulance, etc.
It very well could be from a reduction in people seeking timely medical care, that was something I failed to consider in the write-up but could explain most/all of the discrepancy. As for the significance of the spike, while it is small in absolute numbers (as are the overall deaths in these younger categories), in percentages it’s about the same magnitude spike in deaths as the older crowd saw from COVID (15-18% increase in deaths due to reasons other than COVID/respiratory infections for the 15-44 y.o. crowd compared to 17-21% increase in deaths due to COVID/respiratory infections for the 55+ y.o. crowd, compared to a baseline year-over-year change in deaths in the -4 to +3% range for all age groups). To me, that looks like the results of the response to COVID could have been as dangerous to the younger crowd as COVID/pneumonia was to the older crowd, proportionately at least.
“To me, that looks like the results of the response to COVID could have been as dangerous to the younger crowd as COVID/pneumonia was to the older crowd, proportionately at least.”
True, although a response to COVID isn’t necessarily due to the lockdowns. I’m not defending the lockdowns. People alter their behavior voluntarily. Which is exactly why I’m not defending the lockdowns. Let me put it this way. In regards to covid itself, and it’s resulting deaths, there are essentially two groups of people. There are high-risk people who were going to do what they thought made them safe regardless of lockdowns — they would have stayed home anyway, and low-risk people who were going to ignore lockdowns as much as they can get away with it. So in regards to covid, the lockdowns didn’t alter behavior in a significant way.
LOL headline
NYPost comes up with some doozies.
“Headless Body in Topless Bar”
LOL
Pretty sure his lawyer made a misstatement just like that. Grope instead of rope, anyway. But they improved it, for certain.
Yeah, right here.
nice!
Seen on FB:
“I’m starting to find out who would’ve hidden Anne Frank and who would have turned her over to the Nazis.”
Sad, but true, I don’t like this one bit,
Well, the latter cannot be the ones calling to jail anti-vaxxers, so we know that much anyway.
“See something, say something”
“turned her over to fellow Nazis”
Seems appropriate here: https://qz.com/2045518/does-the-covid-19-vaccine-affect-womens-periods/?utm_source=YPL
Not really that relevant, but since my 2nd jab, I almost completely unable to taste food. It had the same effect on my wife for about a week.
“…completely unable to taste food.”
That sounds horrible to me. I LIKE food.
It’s pretty terrible.
Not for weight loss – jealous!
That is concerning. The article makes it seem like it’s not serious (and hopefully that’s right), but we’ll see. Another factor for women to balance in the risk calculus when deciding whether the vaccine is for them.
Ask your doctor…
SRSLY, thanks for this. I’ve googled some questions and the evil ones just pretend I asked what they wanted me to ask and answer exactly as the government want’s them to. You have to pluck out the number they give you and make your own determination. You did a bunch of that for us. Thanks again.
Current temp: 75
Current dew point: 74
I ain’t going outside, cause I ain’t got gills.
Current temp here, 75 F. Current Humidity 90%.
Tomorrow, predicted high 97 F.
Thursday 98 F.
Friday 99 F.
Yikes!
Yeah, this is a week of suck. Every day worse than the last.
And no wind! Oh Shit!
? Same stats here. Hey, neighbor!
Want my tornadoes and thunder storms?
Temp/dewpoint here: 22/20. Not as bad as you have it but really close. We had a lot of rain today here.
Nice.
No way Short Tony could every have come up with something so well-researched, ratioinal and on point. This is the sort of thing we should be hearing from Our Betters.
Gadfly for the head of the CDC!
Short Tony knows all those numbers, he just spins them differently so people will get their life long jabs just like he was instructed by Pfizer et al.
I’m not so sure. I don’t think he’s that smart, or diligent. Shrewd and clever, yeah. It’s always sounded to me that he was just blowing stuff out his ass. Whatever suited his own interests best.
Gadfly, thanks for digging up the data and having a look for us. It’s really annoying, isn’t it, how the agencies responsible for collecting, collating, and supplying these data screw stuff up so we’re left with holes and things like “less than 2000” for some age categories when other categories are precise to the ones digit?
Part of that is about identifiability. Not all, but some
It’s really annoying, isn’t it, how the agencies responsible for collecting, collating, and supplying these data screw stuff up so we’re left with holes and things like “less than 2000” for some age categories when other categories are precise to the ones digit?
It is possible they have those numbers available in different reports. The reports I found only broke out the top ten causes of death for each age category (which generally covered about ~70% of all deaths for each age group) and bucketed all other causes together in an “other” bucket. So for the age groups in which pneumonia/influenza was in the top 10 I was able to get exact numbers, but for those in which it was outside the top 10 I had to estimate based on how the numbers fit within the totals given for all age categories.
I see, thanks for the explanation.
Thanks
Good info
I have a contestant for the Worse Than Keith Olbermann prize.
https://mobile.twitter.com/jdouglaslittle
Ugh with a guest appearance by crackpot Sulu.
I thought the first guy was a parody when I first saw the tweet. But sadly no. Takei has been a parody of himself for years. Best run of SHatner tweets was just ripping him apart for being a lying scumbag for decades. How a guy whose family actually experienced the internment is such a totalitarian shithead, I do not understand. Hollywood, I guess (and stupidity).
The “For the CHILDRENSSS” is getting sickening from the non-child-having contingent. It’s so empty and obviously about them not children.
I did kids, paid for them, had some grands, Fuck that! Little kids drive me nuts! get off my Lawn!
But, they are our future, be kind and teach them all well,
/and it’s raining like Fuck right now!
‘Splosives. I just might be able to help with the Tucson culture.
ahbt71 at the formerly not evil place.
i’m running lines past a protaganist in a story I’m writing, but the questions just bring up more questions, and new story lines, and Even with storyboards, I haz Confuse.
Help me Oh Glib Writers, oh Muse of Smith…
MUSE SMITH HALP…BY HALP, MEAN RAPE!
WAS RAPE< NO NEED FOR MORE, YUSEF SPREAD SEED ACROSS MICHIGAN!
/Oh Shit!
You know, my wife will kill me when she reads this comment, but we all eventually go, according to popular opinion.
Any way, we went to the Post Office today at around noon to ship a package to Germany. When we were in line, there was a chick, I mean young lady in line ahead of us. She stepped out of line to do something with her package and we were stepping up and I tried to tell wifey ‘hey that young lady was here before us and we need to let her back in line’.
Anyway, wife apparently did not notice her. Which is completely shocking to me because I’m convinced women notice other women more than men do. And she was stunningly gorgeous.
So wifey says to her ‘Was you in line? Really, wifey, were you just comatose for like 15 minutes?
So the young lady says ‘Yes, maam, I was in line ahead of you and I’m going to be late for a meeting, can I please go ahead of you?’.
At this point I was so completely stunned that I was speechless and I just stood there.
So apparently, wifey had let her go first. I barely restrained myself from saying ‘You didn’t see her in line? My gawd, she’s completely…’.
But I wanted to live until at least I got a report done for my biggest client.
So anyway, I managed to keep my mouth shut and live.
But I have to tell you, that was the most completely mind blowing gorgeous young lady I have seen in years.
And then we got to the Post Office Cunte window. I fucking hate that beeatch. And wifey was so nice to her. We stood there for literally 40 minutes of her wasting our time while the line proceeded to go out the door.
Post Office Cunte then proceeds to waste eveyone’s time and then says ‘I’m getting ready to retire’.
I really wanted to scream at her and say ‘That’s what you said last time we were in here and that was 2 fucking years ago! You should have retired then!’.
I somehow by some miracle did not say that.
If I went into detail about his, this thread would go on for virtual eternity.
God Fucking Damn!
If I would have snapped a photo of young lady, y’all would not be around in the morn, cause you’d all be suffering from severe wrist strain.
Man, don’t go postal about it.
The question I have is, did she have a tramp stamp?
No. And I’m pretty sure of it from the amount of flesh she had exposed. No tatts at all. Just pure sex, that’s all.
No Tats is Best.
She didn’t need any of that, she had pure natural beauty. Long dark hair, beautiful dark eyes, drop dead legs all the way up to her ass, and completely exposed belly with no tatts, no rings, she was just gorgeous head to toe.
And my wife didn’t even see her! Which just proves all the women they notice are not he ones we notice most!
I’d look at the face anyway.
One of the top 5 most beautiful women I ever saw was in the crowd of BBC Antiques Roadshow. Like young Liz Hurley but sweeter expression. I took half a dozen pics of the teevee.
Face? She had a beautiful face. With a body like that, who the fuck cares?
Well, straight middle-aged lady speaking.
Hair, eyes, “head to toe”, you said.
No one is going … umm, these euphemisms!
But, she deserves every bit of praise I can give her and more. If you would have seen her, I’m sure you’d agree.
Was I right or was I wrong?
GREAT SONG!
I know, rite?
Have to say – I love the schadenfreude of the mail-order Glib bride squad complaining about their wives.
Hey, are you propping up the USPS?!
/smirk
Brazilians are hardly mail-order in the Northeast.
Also, Brazilians, of both sexes, are pretty awesome.
I’ve overheard that more than once from a PO functionary.
And they’re always like 50 years old. Woe is you, asshole.
Your wife noticed her quite clearly and is now planning your punishment for noticing her yourself. It was nice knowing you.
Not all wives are like that. I miss being 21 physically, but not mentally.
SOW, sorta: these idjits are mostly students a/o tourists, not locals. https://m.youtube.com/c/markdice/videos
Neph and I were talking about how manny people we knew who had COViD and died, none. This includes the large amount of old folks I know.
We both lost multiple people we know to self inflicted deaths over the last 1.5 years.
I believe this is where the spike in 20-55 year olds comes from.
Suicide, alcoholism, drug deaths, and just general poor or neglected health and medical care.
I have no real data to back up my statement, so take it as two persons experiences.
I would be curious how this period affected places like UT with a large non drinking close knit population compared to say Colorado.
I would agree, the Wife bought it from CCP Virus, but I have lost 5 friends in the same period, drugs, health, depression, but all between 52 and 57, Yikes indeed,
I don’t know anyone either, but I’m kind of a loner so ??♂️. If anywhere, I would have expected to hear about it at work but nope.
We got a guy at work who’s mom died of it. He’s forty something, so she is in the normal age range. Other than that, none.
My dad, but COVID was below renal failure and that was a result of the cancer he ignored, so died with. Buddy who just passed most likely was due to complications of it but again, he had diabetes and that is what we knew about. The disease reaps people, but unfortunately the media and medical profession has chosen it as the premier vector of death.
I don’t know anybody for sure who died of it…
A hardcore Branch Covidian relative told me that “such-and-such’s family had a big gathering for Thanksgiving and invited their 89-year old grandma, and guess what? She died of COVID!” I’m not sure if said grandma actually died of COVID or simply died after having a positive COVID test at some point in her life, and given the deceitful numbers games that we all know about, I assume it’s the latter until I see definite proof.
My 56 year old uncle got the WuFlu immediately after open heart surgery following a massive heart attack that almost killed him – his surgeon apparently was infected and didn’t know it yet……and he survived it just fine.
https://archive.li/5tF6z/b25ccdf3e717711e7814f38ca8cbe3149e6043da.webp
NSFW.
https://archive.li/bJEaJ/9abd4acaef4ab07694e0f468248cfb4ec9f60c6f.jpg
NSFW.
https://archive.li/gEd9Q/8e63608adad099408329543485f43b3518e4cbbb.jpg
NSFW.
https://archive.li/zp8mk/7efe9fa6bdf067d72aa86f6abfc380917393c70a.jpg
NSFW.
Yusef is here, Yusef asks? Readheads?
Ba-zing!
I don’t care if that photo has been airbrushed to hell and back. It’s great.
Thank you.
I always struggle to understand the numbers.
I’m not gonna worry tonight.
Then you’re doing it wrong.
Love.
The Media
Don’t care. My new basement gym is ready for action!
Look the fuck out, GlibFit!!
?
“Basement gym” Well, I guess someone gets a workout down there.
Great article Gadfly.
Gadfly, thanks a lot for your analysis. I haven’t seen these breakdowns anywhere else. What I find particularly interesting is the huge spike in mortality among the 25-44 group in 2020. It’s higher than the death rate increase among the 65-74 cohort. The former group had a very little risk of dying from Covid. Unlike the latter group.
Does Cuomo locking Covid patients up in nursing homes count as death by human action, or death by Covid?
Looks like Tundra got out just in time.
https://twitchy.com/brettt-3136/2021/08/10/minneapolis-democrat-party-chair-writes-that-setting-a-police-precinct-on-fire-was-an-act-of-pure-righteousness/
Meh. Commies are thick here, too.
That said, even my proggy peeps are wondering just what the fuck is going on.
(Hint: Big money funding DAs and judges.)
Individual responsibility has gone out the window Volume 1,432,543
I spent 4 hours at the course today, and after 15 holes Angela showed up! We are great friends at the very least, we spent the next3 hours holding hands and talking, oh and played some golf.
She says she’s not looking for a relationship, fine with me, but doesn’t this appear like Fuck Buddy territory? she is leading, not me, How should my socially awkward self deal with this?
Glib, please – you expect any of the misanthropes here to have dating advice for you? No, we do not.
(tho, she wants the Yusef D. She’s just trying to be a bit protective of herself by saying she doesn’t want a relationship. Roll with it, see where it goes)
Be a friend. If it goes somewhere, great. If not, that is okay. Or..and it is crazy and my socially awkward self doesn’t follow this advice…just ask? Both adults, clear the air and if its more friendship than fun times, then you have gained in either case.
Modern rules:
“may I put my hand on your right breast, under the sweater but above the tee-shirt?”
“may I slid my right hand under your tee-shirt, over your bra?”
repeat, with greater specificity.
We got that, she got sleeky soft Boobies, little is OK, odd for me, but cool
So glad I am married and if that falls apart or she passes, I will make it my mission to have enough money for those urges.
“I pay them to leave”.
All love to my wife, but I understand that sentiment.
This, no more Wendy, let’s have fun! it’s been long enough,
Thanks to you both! Imma just chill, but gott she gets me… Damn!
and she’s a great Cali Friend in MI, which is good
Just go for it and ask her if she wants to fuck. When she gets mad and turns away, yell “I guess a blow job is out of the question?”
From some 80s comedy movie which I can’t remember the name of.
Don’t ask me for advice, I couldn’t get screwed in a whore house
Not a good answer, but hey, blowjobs…
Sure why not.
https://www.breitbart.com/politics/2021/08/10/biden-checking-if-he-can-stop-florida-texas-mask-mandate-bans/
It is right there that the Executive can dictate how States handle their business in the Articles of I Win.
Hopefully it’s:
*checks*
“nope, no authority to do that”
In practice: ¯\_(ツ)_/¯
See, also: penaltax
Know what is awesome…for the time being I can freely purchase bourbon. I will continue that.
*sips vodka, since I’m out of rye*
I should really learn to make booze. In a way that doesn’t poison myself or anyone else.
Easy enough, just get rid of the intitial Turpines etc. then Drink!
Don’t use an old car radiator as a condenser.
This reeks of desperation. He knows he can’t. He knows it won’t survive a court challenge. And he will be embarrassed when it fails. It ain’t gonna happen.
Breitbart creeping in on Daily Fails territory. However, the ball girl who took down the field runner at the game is quite the pretty little thing.
https://www.breitbart.com/sports/2021/08/10/watch-hero-dodgers-ball-girl-tackles-fan-field/
Fuck that guy. If I paid to see the game then I don’t want his douchebaggery interrupting it.
Yeah, baseball girls are not my secret fetish… Goddamn OBE! If only she’d been wearing a sundress then the tableau would have been complete.
https://m.soundcloud.com/lrexy21/catfish-and-the-bottleman-i
?
(Fuck youtube.)
https://www.nj.com/advice/2021/08/dear-abby-parents-told-that-their-son-and-his-wife-are-swingers.html
No pics. ?
Judging from my limited anecdata regarding swingers and nudists, count your blessings, Friend.
https://www.wgal.com/article/orleans-massachusetts-fisherman-nearly-catches-great-white-shark/37272992
Nearly catches. How is that news worthy?
*Stretches out arms*
And it was THIS BIG!
*Stretches out foreskin* Everyone flees the room.
They have black eyes, like a doll’s eyes, until they bite ya and then they roll over white and they tear you to pieces. Or they don’t because you didn’t land the damn thing. You’re right, how’s this news? Also, looked like a sand shark to me.
https://m.soundcloud.com/collidoscopemusic/shakedown-street-collidoscope-remix
?
Groovy.
A definite improvement over the original, from what I recall of it.
Good morning, Sean – and Chip and Stinky!
Howdy!
Triggered! Sounded too much like Disco Dance Class when I was a spotty, smelly 14 year-old made to get up close and personal with your crushes and the dushes. I remember one kid that developed late and he had to dance with a partner that must have gone 250. Why? Why did they try to scar us so? No disco for this feller. Mind you, aside from the Hubba-Bubba scent that every girl wafted, they smelled just as bad as the worst of us. We had crusty socks and they had teddy bears.
https://nationaldaycalendar.com/national-presidential-joke-day-august-11/
It’s Joe Biden day!
/He’s a joke.
Can Pie account for his whereabouts last night?
If the punchline is a corrupt old man with erotic dementia that seems to be focused on, uh, younger females then the joke sucks. At least Trump’s mushroom dick was funny.
Whatever you say, Brooksie! ?
Yeah, whoops…and ‘mornin.
Grr…
I have 0 remote sessions and I’m getting told Maximum Sessions Exceeded.
I guess I’m not working today.
Lucky duck!
My boss is having his weekly WFH day today, so there’s a chance I might get something done.
How’s things otherwise?
Well, I’m feeling unproductive since I didn’t get anything written recently, and I forgot I put a pot of water on the stove… brb
Thankfully the goal was to get the water to boiling, so there isn’t any damage done.
Oh, good! You didn’t burn it!
Maybe I’ll send you some writing tonight that’s bound to make you feel better about your own. It might get me jump-started, too – I’d been doing so well about writing at least a little every day, but I’ve neglected it for about ten days.
I don’t react that way when reading other people’s work.
for some reason, reading and writing are solidly separated in my mind.
I’ve burned water before. Put a pot on the stove and got distracted chasing a wayward dog. TBF, I burned the pot and evaporated the water.
Mornin’! This is a problem, how?
Hey Gadfly! Thanks for enacting our labor for what most of us know and believe. Nice work!
https://nypost.com/2021/08/10/las-vegas-mom-who-got-over-200k-in-donations-for-rent-admits-shes-just-the-sitter/
Helluva grift you got there, lady.
SMDH. I hope GoFundMe reimburses every last penny to the suckers who helped this fraud out, but I doubt it.
It’s all gone. Like tears in the rain…
Apparently GFM has the funds on hold but I’m betting political and social pressure will make them buckle and pay out at least something.
She should have used puppies, they’re harder to verify.
JFC.
Sounds like the grifter got an assist from CNN. I have no pity for the dupes who fell for it.
claimed she was facing eviction
There’s your red flag, right there. When was the last time anyone was evicted?
Me, about 30 years ago but my bank opened up and I was fine later that day. *not George Thorogood*
Don’t care for bourbon, scotch, and beer? Mornin, Festus!
Just the beer, nowadays! Landlady got burnt a few times and I was out of town. Came home to find a notice on my door.
She be hollerin bout the front rent, she be lucky to get the back rent
Ha!
If you are cutting a rug to George and the Destroyers, you are guaranteed to get laid. It’s an Iron Law.
suh’ fam
whats goody yo
Good morning, homey! And Fes and TH and rhy! Already greeted you, Stinky. Guess I never properly greeted U, so… good morning, U!
The relative stupidity is upwards of 80% out there. Enjoy swimming to your car.
Its already steamy and only going to get worse.
No kidding! Stepped out back briefly to check on the world in general and the garden in particular. Was shocked at how warm it was already.
More zucchini coming in the garden, and my planted-much-too-late sugar snap peas are FINALLY flowering, though only at the very top of their tall vines. What gives, guys?
Hi!
Bye!
Dreading my work day climbing ladders and crawling across a roof in high heat and humidity.
*sigh*
And I’m off! Have fun, kiddos!
Chowwie-Wowwie edible cannabis. Mellow as hell and I really need some mellow in my life right now.
“Arrest Warrants Issued For 52 ‘Fugitive’ Democrats After Texas Supreme Court Slaps Down Democrat Judge”
https://www.zerohedge.com/political/arrest-warrants-issued-52-fugitive-democrats-after-texas-supreme-court-slaps-down
Damn, maybe not the best idea creating martyrs and all but it looks like they just might do it.
Their martyrdom was cut off at the shins when they posted those stupid faculty lounge pictures on the private jet and then 5-6 of them tested positive for Covid. This goes nowhere.
https://www.dailymail.co.uk/news/article-9880909/Study-Teenage-boys-14-TIMES-likely-suffer-rare-heart-complication-Pfizers-jab.html
Safe and effective!
Teen-aged boys not getting jabbed is a very good plan according to this former teen-aged boy.
Damn your nimble fingers!
😉
https://www.upi.com/Health_News/2021/08/10/coronavirus-vaccine-teens-myocarditis-study/9051628602366/
The condition, which is rare, is characterized by inflammation of the heart muscle that affects its ability to pump blood to the body.
How rare?
Through mid-July, nearly 9 million teens in the age group had received at least one dose of the two-shot vaccine, with just over 4% developing myocarditis, according to data released Friday by the Centers for Disease Control and Prevention.
So, “only” 360,000 developed myocarditis. But wait, there’s more!
All 15 patients in the study were hospitalized due to the heart complication, but all were discharged after an average of two days without the need for intensive care, and only one had lingering symptoms.
That’s OK, it’s not as if hospitals are being overwhelmed by… COVID patients.
… the long term cardiac effects remain unknown,” study co-author Dr. Audrey Dionne told UPI in an email.
Well, at least we now have a long-term study in progress. Can’t wait to see the results.
Just wait until the booster shots get rolling. That should make for some interesting times.
Just wait until about of 1/4 of the workforce is caring for invalids. A good time will be had by all, to be sure.
Good-paying jobs! Stimulus FTW!
“workforce”
No one wants to work anymore.
UBI!
I see a return to multi-generational families. The kids and the old folks can’t fend for themselves much longer. Who knew that GenX would save our bacon?
It’s not enough to stigmatize, marginalize and neuter the boys and then attempt to quash their impulsive nature, now we’re going to cull them. For The Greater Good. *half-assed tin foil hat donned*
You know who else broke a bunch of teenaged boys hearts?
Army physicals?
Bonnie Tyler?
Audi looks to make an uglier Camaro.
Jugsy’s ’16 Camaro does nothing for me.
I saw a new one yesterday and it looked pretty sweet. I’m not one to draw attention and car stuff ain’t my bag.
3`2w