I’ve been led to understand that “Never Apologize!” is a sort of Glib motto, right up there with “FYTW” and “Is that a euphemism?”. That said, I’m feeling a bit like Robert Jordan here. This was supposed to be the final episode, but it got too long. So this is Part 3… of 4. Hopefully the intermediate parts won’t be as boring as his intermediate books and, more importantly, I won’t suffer his fate before finally ending this.
In Part 1, the measurement of cosmological distances using standard candles was introduced. In Part 2 a couple of types of standard candles, Cepheids and SN Type 1a were described. Here, we’ll go over how the analysis of very distant Type 1a supernovae (Type 1a SNe) seems to indicate the not only is the Universe expanding, but that the expansion is accelerating, the later property implying the existence of “dark energy”. The exact nature of dark energy is not understood; it is simply a property of the Universe postulated to explain the observed apparent acceleration. There are post hoc physical mechanisms that have been put forth regarding what dark energy is, but those are beyond the scope of this article. A lot of the time, if you read “beyond the scope” in a scientific paper, it means “I don’t know” or “I’m lazy”; I’ll leave you decide what the proper translation is here.

Simple Hubble diagram, velocity measured from spectra on the vertical axis, distance measured from Cepheids on the horizontal axis.
Back in Part 2, we saw that observations of the Cepheids implied that the Universe was expanding. Most people have heard of Edwin Hubble, if only through the fact that the Hubble Space Telescope (HST) carries his name. Hubble became famous, or as famous as an astronomer gets, by noting that the recession velocity of a galaxy was directly proportional to it’s distance; the further away a galaxy was, the faster it was moving away from us. The simplest explanation for that observation is that we live in an expanding Universe. The distance to an astronomical object is very difficult to measure. But, given Hubble’s diagram, we know that, if we can measure the velocity of distant galaxy (more easily than the distance), we can immediately read off distance to that galaxy without even having to measure a standard candle in that galaxy!
So how does one go about measuring the velocity of a galaxy?

A siren – half of what most astronomer’s probably wish they studied instead of a bunch of squiggly lines on a plot.
In astronomy, velocity is almost always measured using the concept of the Doppler shift. We’re all familiar with the phenomena from our exposure to sirens. When a vehicle with a siren is approaching you, most likely to hassle you for your joint or to try and stop you from having ass-sex with an illegal Mexican, the pitch of the sound is shifted higher. When he passes you by (and you realize he’s actually after the un-vaccinated person without a mask trying to go grocery shopping), the pitch of the sound is shifted lower. This phenomena occurs because, as the siren approaches, each successive air compression (sound is perceived as a result in variation in density and pressure in the air setting up vibrations in your ear drum) is emitted slightly closer to you than the last due to the motion of the vehicle, so the peaks will be closer together. Conversely, as the siren recedes, the peaks will be further apart. The distance between the peaks in the air compression/density of the sound wave, its frequency, is what our brains perceive as pitch. So we perceive the pitch of an approaching siren to be of higher pitch and the receding siren to be of lower pitch. Since light is also a wave (thanks Maxwell!), the same phenomena occurs. Light emitted from an approaching source will shift to higher frequency, from a receding source, to a lower frequency. In contrast to sound though, rather than pitch, we perceive shifts in the frequency of light as color. In our evolutionary determined visual system, we see things in the optical and in the optical, blue light is “high” frequency and red light is “low” frequency. So, in common parlance, something moving away towards us is called blue-shifted and away from us, red shifted.
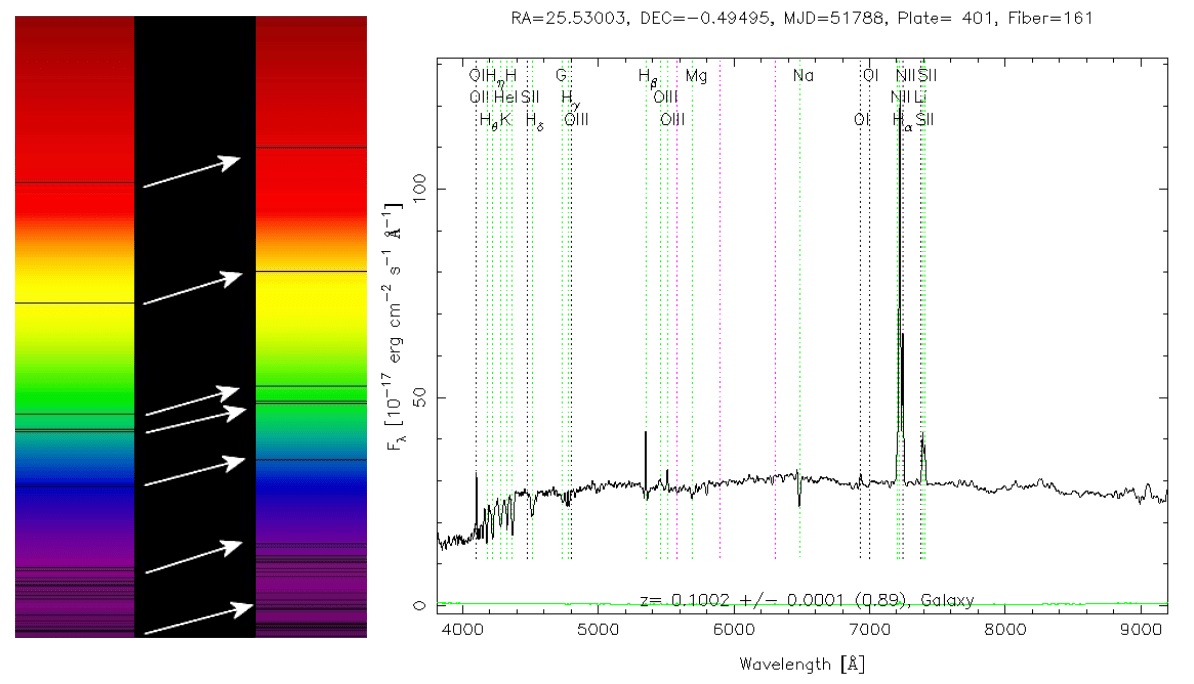
Examples of redshift; on the left, the concept. On the right, actual data. In both cases, atomic lines from a given element are shifted with respect to their rest (non-moving) wavelength by an amount proportional to the velocity. For example, on the right, the line labeled H-alpha is emitted at 6563 Angstrom at rest in a vacuum, rather than ~7200 Angstrom in this galaxy – that shift tells you how fast the galaxy is moving away from you and hence its distance.
Now we just need a way to measure the frequency of light of the light. That’s most commonly done by looking at the spectra[:s/a/e within] of astronomical objects. Spectra are just plots of the brightness of an object versus frequency (wavelength). All elements have unique spectral signatures determined by electronic transitions between energy states in the atoms of that element and since the available energy states of each element are unique based on the structure of that elements atom, there are features that appear in the spectra of each element at unique frequencies. At rest, we can measure the nominal frequencies of all these electronic transitions and create a unique fingerprint of each element. When an object is in motion, the frequencies will be shifted to the blue (if approaching) or to the red (if receding), with the amount of shift being directly proportional to its velocity. So in very simple terms, measuring the velocity of an object is accomplished by taking a spectrum of an object and measuring how much lines of various elements are shifted with respect to the nominal, or “rest”, wavelength.

The expansion of the Universe is apparent on a large scale – for example, not all galaxies are moving away from each other – in fact our own Milky Way galaxy is on a collision course with our nearest (large) neighboring galaxy, Andromeda. If you look at a spectrum of Andromeda, you will see a blue shift. One has to map velocities on a large enough scale to be in the “Hubble flow”, where the local motions of galaxies are dominated by the cosmological expansion of the Universe.
Now back to the expansion [velocity] and acceleration. In the Hubble flow, we can measure the velocity (red-shift) of a galaxy and directly read off the distance if we assume a cosmological model, a model of how the Universe is expanding. So how do we infer an accelerating expansion? Briefly, one looks at very distant – in the Hubble flow – Type 1a SNe (Part 2) and measures the red-shift of the galaxy they occur in. As we saw above, for a given cosmological model, e.g. a uniformly expanding Universe with a given constant (on large scale) matter density, the red-shift (recession velocity) translates directly to a distance in that cosmological model. But as we saw in Part 2, owing to the standard candle nature of Type 1a SNe, we have an independent way of directly measuring their distance. We simply measure their apparent brightness and infer an intrinsic brightness from their light curve characteristics. So with the apparent and intrinsic brightness we have a direct measure of the distance, independent of the cosmological model.
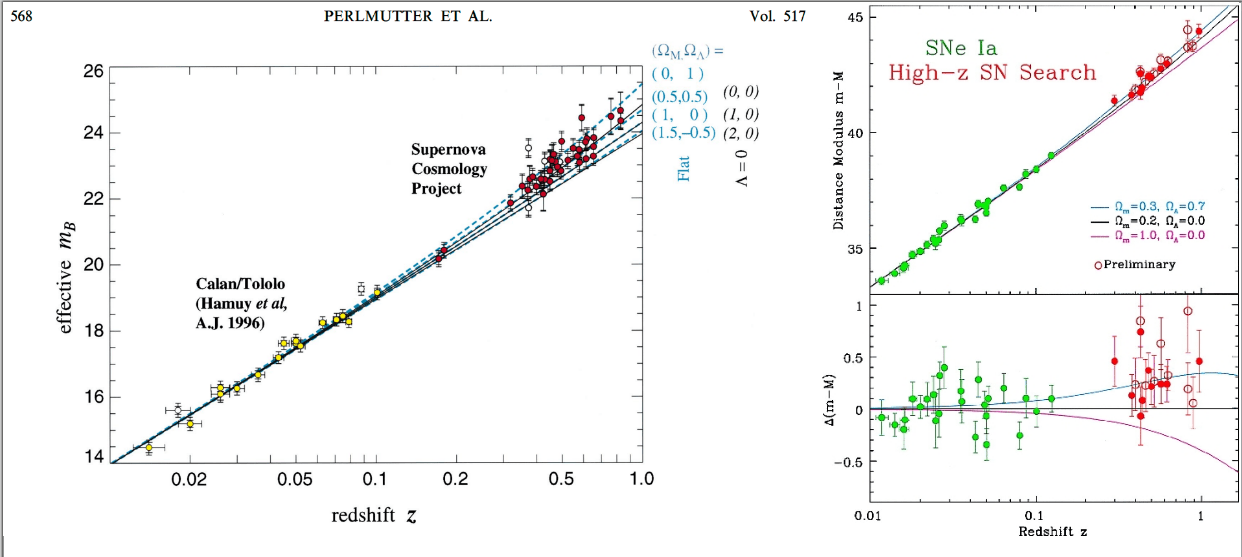
The evidence for accelerating universe. Left – from the ‘discovery‘ paper. Right – a bit more clear. The ‘cloud’ of red points are the evidence for an accelerating universe; they fall systematically above the black line which represents a uniformly expanding universe.
Now we have all the elements we need to see where the postulate that the expansion of the Universe is accelerating comes from. We take the baseline as the distance inferred from the red-shift (measured velocity of a large sample of galaxies) with our best, non-accelerating, model of the Universe and compare that the distance we find directly from the Type 1a SNe for that same set of galaxies. The difference between these two measures is called the “Hubble Residual” or HR. If our model of the universe is correct, it should be 0 – the distances we determine from ‘independent’ means for the same sources should be the same, otherwise, one of our estimates is wrong. When we do that for these data, we see a positive HR. This means that the measured Type 1a SNe are more distant than the ‘null hypothesis’ of a uniformly expanding none-accelerating Universe would predict. That’s it. The only way (if you believe all the observations, assumptions, and models that precede figuring out the distance to Typs 1a SNe) for that to happen is that the Universe is accelerating. And if the expansion is accelerating, you need to put some energy into it. Since we don’t see or measure said energy in an independent way, it gets the moniker “Dark Energy”. Note that the effect is fairly large, roughly 20% in brightness, so it takes a fair amount of error to explain away, which is part of the reason people have some confidence in the result.
And with that, the stage is set for Part 4, the truly final episode. Hopefully it doesn’t become Parts 4 and 5 with page after page of Rand al’Thor lamenting that he doesn’t understand women while some man who identifies as a woman smooths his skirts and tugs on his penis.

Yes, it is, next question?
What if it just loops back on itself? I think the universe being infinite is too problematic for me. an infinite universe would have infinite problematics. I prefer the idea of an incredible immense but finite size of universe.
I guess there may be ways to tell but any universe size over the cosmic horizon may as well be infinite.
The expansion of space creates the space around it, if you know what I mean,
I just don’t like infinities. I think I would prefer it if dark energy simply wasn’t.
But I live in the universe as it is and not as I wish it were.
I don’t believe in dark matter, it’s just a catch phrase for we don’t know what the fuck it is.
It does have quite a bit of “fudge factor to make the math work” about it.
That ties in to the question of whether spacetime is curved (positive or negative) or flat. I seem to remember an article from a few years back which reported that, after calculation and measurement from various instruments, cosmic physicists are now convinced that spacetime is essentially flat, which implies that the Universe is infinite (though we can’t see beyond the 13.5 Billion years “observation horizon” because information doesn’t arrive to us faster than the speed of light). Amongst other things, that may also imply that there are an infinite number of copies of us.
Too much of a good thing, I s’pose . . .
What always kinda fascinates me is that in a universe that randomly spewed out a mostly hairless ape with a slightly enlarged brain is the presumption that said ape & brain have any reason to believe it can fathom the universe it exists in. In this case, we’re just story-telling with scientific embellishment and like most theories and most humans – we’re spectacularly wrong.
On the other hand, if we are the product of a divine design, then presumably some residue of that divine presence lives in us. Save that kind of makes us a homeopathic entity. But at least there is a little more plausibility as to why we might have access to the secrets of existence, even as limited as our grasp is.
On the hand gripping the shenis, said hairless ape and brain have done a pretty damn good job fathoming the universe and the laws that govern it. I’m not really sure I can grok what it means to fathom the universe or have access to the secrets of existence. What if there are no secrets? It just is, and to the degree you can understand the physical laws, you have access to fathoming it?
FUCKING WP, decided I wasn’t logged in when I went to post. I’ll summarize.
We don’t know that the universe is consistent, we just assume it is. We could just be living under local conditions, and other regions could be different. We have no way of knowing one way or the other.
Dark matter and energy are accounting plugs – they balance the cosmic books. That should be a pretty big red flag that we don’t know something important. Under our local conditions, we think of space and time as independent things, but at the cosmic level, it’s space-time – and not independent at all (save for us imposing our local perceptions on it).
That’s kind of the point and why people are excited about it.
I thought people were invested in proving the existence of those, to justify the accounting plug.
The way I see it is that there are some people who appear to be invested in proving the existence of dark energy and/or dark matter, and they allow themselves to make statements that imply they “believe” they really exist, which is unfortunate.
The real scientific question is “what is truly responsible for creating the observed phenomena that require the placeholders of ‘dark matter’ and ‘dark energy’ to be inserted into the current models of the universe to make those models more accurately reflect the observations?”
I thought people were invested in proving the existence of those, to justify the accounting plug.
Sort of a general reply; I think Lily I mean not adahn has it; there’s an observation that doesn’t fit with our current understanding of the universe. Dark energy is a hypothesis to explain that observation. That’s what will drive the understanding forward. Things you can’t explain with what you think you know. 99..99% of what people come up with to explain it will be wrong. Hopefully someone figures out the 0.01% that advances us a bit. Now whether our assumption of constancy of physical laws across space and time is valid and hence whether they way we are thinking about things can actually get to “THE” answer… who knows. But maybe by pushing those boundaries we’ll find out?
Now of course in any field, there will be those who become invested in some part of the 99.99% and will distort things to match what they believe. Science and scientist are not immune to that, nor, I would venture, particularly better at avoiding it. So there’s certainly going to be some (maybe most) of that happening. Which is why it is so important to keep scientific institutions and discourse open.
I’ve always like the spin of Feynman – the purpose of science is to not fool yourself, it isn’t about not fooling other people.
Well, I understood some of that.
The colored lights?
The siren.
I’m not even going to pretend that I understood any of that but the sun did come up in the east again, good enough for me.
Speaking of which, November and December seem be the gloomiest months of the year. Short days, not a lot of sunshine. I much prefer the sunny, cold days of Jan and Feb, even if they are so much colder. The sunshine is always welcome this time of year. Sunny today and like James Brown, “I Feel Good”.
I knew that you would, now.
I’m with you Fourscore on not pretending to understand. For me, it is enough Q favors us with NSFW postings so we can look back on our misbegotten youth (not that it was populated with such creatures).
Nicely done!
Thanks, PM, I’m grateful for you and all the others that know so many things. I feel better and safer. Your articles are appreciated.
Since light is also a wave and a particle. We assume much about the universe that we probably aren’t quite justified in assuming.
Space. The final frontier.
Also, “We need more funding to study this topic in greater depth.”
“idiopathic” [insert condition here]
The scientific way of saying “today, my jurisdiction ends here”.
Depends. I’d say most of the “beyond the scope” requests I get from reviewers are truly beyond the scope. One example is a study on the effects of treatment for diabetes in American adults and a journal reviewer wants to know why we didn’t include the economic impact of this treatment on children in BRIC nations (Brazil, Russia, India, and China). True example from last year with just a couple variables changed.
True. I was just having a little fun.
Me too. Sometimes it’s a legitimate claim. Other times….
So, the acceleration keeps growing until the boundaries of our dimension get stretched too thin and the old gods return?
“Ph’nglui mglw’nafh Cthulhu R’lyeh wgah’nagl fhtagn”
…until the
boundaries of our dimension get stretched too thinstars are right…“There was chanting in the air that night. The stars were right. Cthulhu You were dreaming of your destiny, beneath the sea. Cthulhu.”
That’s so good.
And it led to this: https://www.youtube.com/watch?v=LZsoXT1KBuA
That was…glorious!
On that note, printing update from the “Call of Cthulhu” kickstarter that someone (EvilSheldon?) linked to a while back.
I’m looking forward to receiving my copies.
That reminds me, I’m wondering when my copies of “Pistols of the Warlords” will ship out.
#metoo
Just checked; evidently they were having printing issues, and ended up having to get it printed in China, and then experienced some censorship issues…which may or may not be worked out now…
I saw that update.
The Chicoms were pissed about the maps which depicted China during the Warlord Period, but weren’t pissed about any of the text. So, the maps are being printed outside of China, the books in China.
Cool.
Top 100 images from the Hubble telescope.
C’mon, man, those are Hunter’s paintings, aren’t they?
One of the questions I have about dark energy is illuminated by your statement:
If we define the Universe as a closed system–which should be consistent with the idea of a “Universe”–then “putting some energy into it” implies something outside that universe, assuming conservation of energy is observed.
Could “Dark Energy” simply be a flow of energy (or matter converting to energy) through some sort of connection to another Universe?
On a somewhat weirder note, could the evidence in favor of dark energy be considered an indication that our Universe is actually a simulation that requires some constant input of energy to maintain? One would think that if it were a simulation, that the operator of the simulation would know this, and attempt to tune the energy input such that occupants of the simulation would see a constant expansion, or at least a condition that wouldn’t imply a net input of energy.
I have long wondered whether Dark Matter might be “regular” matter in a closely coupled alternate Universe rotated out of our three dimensions but very closely adjacent in an additional spatial dimension that we have yet to perceive.
Even weirder, since we can’t directly measure the presence of Entropy, but we know it must increase in our universe, could two universes be closely coupled, and transferring some quantity that we would measure as Entropy in our Universe, but the adjacent Universe would measure as Dark Energy, and vice versa?
Of course, weirder yet, but more sinister, might be the possibility that we live in a Rick’s Battery universe and what we perceive as an increase in Entropy is a “theft” of energy from our universe to his car.
This isn’t impossible but then again, how would we know? I am one of those children who was given an existential crisis from Horton Hears a Who so I try not to think about it too often.
I chuckled.
Weirder still – that would be a more satisfying answer.
I think the most ‘mainline’ interpretation is ascribing it to the vacuum energy, so it’s a quantum effect. Something like the ground state energy of space. From what I gather though, most field theories would predict an enormous vacuum energy, so it doesn’t work too well. An external input? I’m sure some string theorists have come up with some extra folded up dimensions that produce dark energy. Things like parallel universes are a problem in that most theories (that’s probably giving them too much credit – WAGs?) of parallel universes require strict separation/no communication between them – no slithering of noodly appendages across the dividing line.
https://www.engadget.com/dodge-is-killing-its-challenger-and-charger-muscle-cars-in-favor-of-e-vs-085839976.html
Lame.
Well if that doesn’t sum up the state of American society I don’t know what does.
This is just for gasoline vapor emissions on a modern vehicle.
https://www.aa1car.com/library/evapobd2.gif
Failure of the two solenoids will trip check engine light and various pressures and lack of pressure at certain times will also trip the check engine light. This has nothing to do with tailpipe emissions. Just simply not venting evaporating gasoline.
This is the way first world governments are killing internal combustion.
Next for tailpipe emissions we’ve got to recirculate exhaust gas. However, to meet ever increasing fuel economy regulations we’ve got to go to direct injection. Put the two together and…
https://www.autoguide.com/auto-news/2015/01/is-carbon-buildup-a-problem-with-direct-injection-engines-.html
You’d have it with direct injection to begin with, but putting the two together makes it worse.
NNNNNNNNNOOOOOOOOOOOOOOOOOOOOO!!!!!!!!!!!!!!!!!!
Rand al’Thor lamenting that he doesn’t understand women while some man who identifies as a woman smooths his skirts and tugs on his penis.
This bit at the end nearly made me spew my drink all over my laptop.
Excellent article, really enjoying this.
When a vehicle with a siren is approaching you, most likely to hassle you for your joint or to try and stop you from having ass-sex with an illegal Mexican,
🙂
When an object is in motion, the frequencies will be shifted to the blue (if approaching) or to the red (if receding),
So… if I drive really fast towards the red light, it will appear green?
Indeed you could. But you’d have to be going some substantial fraction of the speed of light. Probably need a new EV-Challenger from Dodge.
I’ve thought for a while that I’d like a really fast car that’s painted in a sort of iridescent scheme with a color shift so that it looks blue from the front, red from the back, and white when viewed from the side.
I would totally buy something like that. Geeky, but subtly geeky, not in that IFLS cringe-worthy signalling way.
Yep. No bumper stickers. You either get the reference or you don’t, no worries either way.
Plus what do you with the clock in the car when you get home?
Electric vehicle? No. Contrary to popular belief, I have standards.
I used to drive a firetruck in the Bronx. The faster I went the skinnier the rig got which helped me get through tight spots.
If our model of the universe is correct, it should be 0 – the distances we determine from ‘independent’ means for the same sources should be the same, otherwise, one of our estimates is wrong.
Good thing astronomers aren’t climate scientists.
Hahaha
Hopefully it doesn’t become Parts 4 and 5 with page after page of Rand al’Thor lamenting that he doesn’t understand women while some man who identifies as a woman smooths his skirts and tugs on his penis.
AGH!
On a serious note, this series is an interesting read.
It Should Be Free to Take Your Dog to the Vet
It’s not enough that other people should pay all my bills, but other people should make sure I can have a dog for free too.
I should be able to go to the range and have other people pay for me to shoot unlimited ammunition. Hear me out!
Hell, I’d be happy if Amazon would subscribe & save me some ammo.
15% off a case each month and free shipping? Sign me up.
hmmm…thinking about starting an ammo-of-the-month club now.
Every month, you get a curated selection of ammunition selected by a panel of our Glib firearms experts. Once in a while we’ll throw in a box of something out of production, and you get a rare chance at receiving a single round of collectible ammunition.
+1 5.5mm Velo Dog.
You laugh, but The Blue Bullets does have a monthly bullet subscription program.
I use and recommend the 9mm 147grn. flat points.
Huh. Works fine for me.
Perhaps I’m just better at tapping on links?
“I use and recommend the 9mm 147grn. flat points.”
I second that. And third it.
Don’t you mean curated by a panel of Glib makers?
grrrrrrrrrrrr
#metoo
Ironically enough, you get a good estimate of the cost of treatment from a vet, and you don’t get billed later because insurance didn’t cover something. I think our medical system needs to learn something from the veterinary world.
Veterinary medicine is structured like plumbing or auto repair, while human medicine is structured like legal services.
^^^
Get comfortable with euthanizing grandma?
Isn’t that what the un-vaccinated, no-mask-wearing, anti-lockdown heathens are already doing? We’re already half way there! The next step is leather collars and leashes for everybody…
Hey, No need to bring your kink into this discussion. Save it for something on topic.
Every time I think we’ve seen Peak Stupid…
Related question:
If you could create a universe-in-a-box and enslave all the inhabitants of that universe such that the box would provide you one, and only one, of the following, which would it be?
1. unlimited health care for all inhabitants of our universe
2. universal basic income for all inhabitants of our universe
3. universal higher education for all inhabitants of our universe
4. unlimited freedom and liberty for all inhabitants of our universe
This must be avoided at all costs. People may do things that I of which I don’t approve.
Hey, buddy!
“If you could create a universe-in-a-box and enslave all the inhabitants of that universe”
plus
“4. unlimited freedom and liberty for all inhabitants of our universe”
I’m gonna guess that the sort of person who thinks step 1 is a great idea would find option 4 anathema.
I’d like to think (4), but the inhabitants are enslaved. So I’m going with (5), unlimited guns and ammo to overthrow their oppressor. Which would be me (gulp).
It’s already free to take your dog to the vet. It only costs money if you want the vet to look at the dog.
I dispute this. I don’t have to walk my cats so they can pee or poop. In fact, we can leave them home alone for a few days with no problem. This writer is clearly a speciesist dog supremacist.
I have a cat and a dog. Cat definitely easier. BUT, dog is rewarding in different ways. No one says welcome home like a dog.
I’ve thought for a long time now that the “universe(s)” must be infinitely large and small. Our perception is so limited and our computing power so inept compared to whatever the reality of existence is and in that context, something can always be cut in half and so on…
Just my simple mind’s way of dealing with something it clearly isn’t capable of dealing with.
It seems likely there are realities we will never know due to our human limitations, but I do love to learn about what the best explanations that have been put forth can teach us!
Thanks for the great article!
Obligatory.
https://www.youtube.com/watch?v=JUOGxePBs50
Animal:
Maybe you should host a Brutality match in Alaska
https://www.forgottenweapons.com/finnish-brutality-2021-day-1-featuring-the-infamous-trench-stage/
Host? Maybe. Participate in? Hell no! I’m not longer a young man, and I enjoy my comforts.
Do you like that Japanese market import you legally imported and registered? Well too bad, we are retroactively pulling your state registration with no explanation.
More States Are Banning Legally Imported Cars And Nobody Will Say Why
Were you aware of the AAMVA? Well you are now!
The American Association of Motor Vehicle Administrators is a non-governmental non-profit lobbying organization composed of motor vehicle and law enforcement administrators, and executives from all 50 states. Canada, Mexico, the Virgin Islands and Washington D.C. get representation in the AAMVA as well. Among other things, the organization seeks standardization of laws and practices across the states regarding traffic safety, vehicle titling, and driver licensing.
Just laying the groundwork for banning the import of ICE vehicles
So, those are all public employees of the various states, and why exactly do they need a lobbying organization?
In an organization near and dear to my heart and our Swiss overlord – I’m assuming because there are 50 state standards and this allows consistency and the ability to share regulatory costs and concerns. For the good of the people of course.
NAIC
The AAMVA does some $40M in “business” per year – hard to say exactly what, they are awfully secretive for a 501c3.
For the heck of it I jumped over to their career site. This can often be a good way to discover how organizations work. Looks like they, like many others, are screwed in IT land. However, there is an “Exhibits and Sponsorship Manager” position.
They run six, yes six ******* conferences every (normal) year. My guess if you sell products aimed at this market this is where you buy a booth…
https://workforcenow.adp.com/mascsr/default/mdf/recruitment/recruitment.html?cid=7f5baef3-9cee-4681-85f2-7d738f673786&ccId=19000101_000001&type=JS&lang=en_US&selectedMenuKey=CurrentOpenings
The Conference Services Department manages logistics for all of the association’s conferences, meetings, and events. This position primarily works on the Conferences, of which there are six total. Three of the conferences have smaller exhibit halls of 40-50 exhibitors, while one conference has an exhibit hall of 100-120 exhibitors. The remaining two conferences do not have exhibit halls. All six conferences have sponsors, and sponsorship fulfillment.
Yeah, and on their 990 they have a VP of sales – which just strikes me as weird. What exactly are they selling?
50 labs of1 lab of sort-of democracy!“The owners did everything by the book, making sure that their vehicles were old enough to be exempt from having to meet Federal Motor Vehicle Safety Standards (FMVSS). Many of them even got registrations and shiny license plates for their new rides. But in recent months they all have received confusing and vague letters from their states demanding that they relinquish their plates to their respective department of motor vehicles.”
I am altering the deal, pray I don’t alter it any further.
*chants*
Lawsuit!
Lawsuit!
Lawsuit!
Cash for clunkers part II (or are we at III now?)
We received a rifle I’m struggling to identify. There is a tag that says it’s a Spanish 310 which I can’t find any info on. It’s a 7.92 and has a short wood stock. I suspect it’s some variant of the Spanish Mauser. I can’t get a picture of it yet sorry. Anyone have any idea?
@animal thought you might have an idea.
Actually figured it out. It is a Spanish M43. The short wood stock threw me off.
I wonder if the 310 is a hang tag/item number. I don’t think that was a model number for any Spanish Mauser.
There were a few models of Spanish Mauser. I’d need to see pictures, including any crest if there is one.
Interesting. Fortunately I have my copy of Ludwig Olson’s Mauser Bolt Rifles to hand. The only thing I can find on a Spanish 98, which if this is a 7.92 it would have to be, is some variant on the Spanish 43. This is a 98-action short rifle, in 7.92x57mm, with a K98-style stock and a horizontal bolt handle. This shouldn’t be confused with the 93/95 action Spanish Mausers, originally chambered in 7x57mm, as the small-ring 93/95 actions are much less robust.
Here’s an example of the Spanish 43.
And I see you figured it out while I was looking that up. Well done.
This shouldn’t be confused with the 93/95 action Spanish Mausers, originally chambered in 7x57mm,
That was a brain fart. I forgot they were in 7x57mm.
Game time: guess the author of the quote below. I will give a hint.
Hint: It is not Rand (Ayn or Paul)
One of the stoics. I have a friend that posts a quote everyday on Facebook. This one popped up in the last couple of days.
Hint #2, the author was born in the 19th century and died in the 20th century.
Eh, maybe not. I know I have seen this quote within the last week or so, but I can’t find it.
Found it, but I cheated via DDG, so no credit.
Another quote, which may help (except Ghostpatzer, who is a cheater):
Mussolini and Hitler were among the first to grasp that rulers who wish to make sure of a new social order must train people to it from infancy. They drilled children and youths for years, imposing on them from outside an ideal to unite them. . . . But the cohesive social order is a natural fact and must build itself spontaneously under the creative stimuli of nature. No one can replace God, and anyone who tries to do so becomes a devil, just as when an overbearing adult oppresses the creative energies of a child’s personality.
If only I had found a way to cheat at chess…
Use an engine. That is easy to do.
Lol. Check out the rules designed to prevent cheating:
http://www.chesstour.com/devices.htm
“I play drag chess, all my pieces identify as queens.”
Brilliant!
Branch out into Shogi.
My understanding is that it has very few western players. Top players actually make a living at it, but that seems like a hellish career.
Dread Cthulhu?
Sounds like Nitzsche
That was my first (incorrect) guess as well.
God?
This reminds me of the Heinlein quote about specialization is for insects, so I’m going with Heinlein.
Thanks,PM. The science is way over my head, but I really enjoyed it. Almost makes me wish I had stuck with physics as a young Patzer. Almost.
John McAfee Film in the Works From ‘Plot Against the President’ Director (Exclusive)
I’m sure they meant Red Dawn.
This could be a very good movie.
Milius wrote Apocalypse Now; he wrote & directed Red Dawn (& Conan The Barbarian)
I can’t tell you whether he rolled on Shabbos or not
What is it about food activist chefs that makes them screw up basic facts about food?
Just when I thought “I try to use the whole egg because a baby chicken gave their life…” was the dumbest thing I’d heard an activist chef blather. It may still be, but a new contender wandered by: “A lot of corn has GMOs…” What are the odds she can’t even define what a GMO is? What are the odds she knows that before humans got their mitts on it, corn’s wild ancestor looked more like wheat? Unless you’re modifying that horrible corn-infesting fungus some people decided to eat, corn doesn’t contain other GMOs, it was one of the poster children for modified organisms in and of itself.
Great, great article, PM! Thank you so much. This has been scratching my old astronomy itch.
As a wee lad, I did a fair bit of research on light curves and something known as “the O’Connell Effect” – a strange artifact of certain binary star systems (Beta Lyrae class) – where the light curves of the system have different maxima.
That was my introduction to measurement on the cosmic scale and, holy shit, what a giant helping of humble pie that is/was.
Maybe Dark Energy is just “God.” There, how’s that for making people uncomfortable?
I don’t think many people who Effing Love Teh Science like to hear about the uniformitarianism “hypothesis” pointed out as such because it can make one start to think that Plato’s analogy of the people in the cave with the candle looking at shadows seem a little more apt than we might like. But really, we’re just staring through giant binoculars measuring blobs of light and telling ourselves that we have “understanding” and “knowledge”. I’m not pissing on what we’re doing – nor what we’ve done – but some humility is certainly in order.